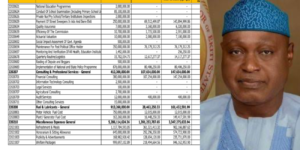
An analysis of budget performance documents has revealed that the Ekiti state government allocated a staggering N902 million for refreshments and meals between January and June 2024.
This translates to a daily average expenditure of N4.9 million on food and refreshments during the first six months of the year.
Notably, this amount accounts for 5.5% of the state’s internally generated revenue (IGR) for the same period, which totaled N16.391 billion. The significant spending on refreshments and meals raises questions about the state’s prioritization of expenditures.
Calculating the daily average expenditure on refreshments and meals is straightforward, given the 182 days between January and June 2024 (31+29+31+30+31+30). By dividing the total amount spent (N902 million) by the number of days (182), we arrive at a daily average of N4.9 million.
Notably, this amount surpasses the capital expenditure allocated to the Ministry of Infrastructure and Public Utilities, which received only N517 million for the same period.
This stark contrast highlights the state’s spending priorities, with refreshments and meals receiving nearly twice the funding allocated to infrastructure development.
A review of the budget performance report reveals a striking disparity in Ekiti state’s spending priorities. The Ministry of Innovation, Science, and Technology received a mere N15 million in capital expenditure, while the Ministry of Health’s capital expenditure was N1.4 billion, with an additional N500 million.
In contrast, refreshments and meals consumed a staggering N902 million. Other ministries, such as Environment (N264 million) and Rural and Community Development (N157 million), also received significantly less funding than was spent on refreshments and meals.
Furthermore, Ekiti state’s failure to access N1.3 billion in Universal Basic Education Commission funding due to its inability to provide the required matching grant is a concerning oversight.
This spending on refreshments and meals occurs amidst pressing developmental challenges, including 85% of households lacking access to sanitary facilities, 76% of households lacking access to clean drinking water and an average time to healthcare of 19.0 minutes (according to the National Bureau of Statistics’ multidimensional poverty index).
These statistics highlight the state’s misplaced priorities and neglect of critical development needs.
